stellargraveyard.blogspot.com

Friday, February 8, 2013

Long nights observing...

It's been a while since my last post, but I think I'll be excused for this :p Now though I have some spare time to get back to the blog. Two major things have occurred since the last blog post. The first was a Kepler observing proposal deadline sometime mid January. This is a great opportunity for me, and people I work with to get the exquisite lightcurves of the cataclysmic variables I've discovered in the Kepler field-of-view (some of which have been mentioned in the previous post and here is one more). Hopefully the proposal will be accepted (first time I propose to NASA, so fingers crossed on that!), and if it does we will be able to obtain lightcurves of about 15-20 cataclysmic variables throughout a whole year at least, uninterruptedly! The great thing about these lightcurves is that it will allow us for the very first time to look at the variability properties of a sample of cataclysmic variables, allowing to infer properties of the cataclysmic variable population in general, instead of only single objects as I have been pursuing in the last year or so (see this post). If indeed all cataclysmic variables show similar variability properties in their optical lightcurves (as observed by Kepler), and that these properties resemble those observed in X-rays for X-ray binaries (accreting black holes or neutron stars), then we will be a step closer in unraveling what is the physical mechanism which drives the growth of these objects, eventually shaping the stellar populations we observe in our Galaxy. At the moment Kepler is the only observatory which allows to pursue this study, and I really hope it gets to observe my targets :)

The second task I've been busy with in the past month or so has been to finish off of a paper and submit it to a journal. In this paper I use the ULTRACAM instrument (amazing by the way!) to study the high-frequency variability properties of two cataclysmic variables (of which one is MV Lyrae). The awesome thing about ULTRACAM is that it is fast(!) and even cooler is the fact that it can simultaneously observe objects in three different filters (red, green and blue). However, before I dive more into this, I'll wait for the paper to be accepted (hopefully), keeping you to wait for my next blog post on this ;)


In the meantime, I am observing at the Roque de los Muchachos Observatory on La Palma (Spain) with the Mercator telescope of K.U. Leuven. The stuff I am observing mainly involves bright(ish) stars, and in particular I am using HERMES to take spectra of them for people in the HERMES consortium. It is the first time I use Mercator (but defiantly not the first at the observatory) and I think it is a very user friendly telescope :) Main issue is that I have to stay here for 2 weeks straight, observing every night until sunset (meaning I'm by myself for about 13 hours per day, with not much else to do for the rest of the time!). On the good side I found some time to update the blog! To show you the real beauty of this place,  here is an amazing time-lapse video made by Péter I. Pápics at K.U. Leuven, showing the Mercator telescope in action, and its awesome surroundings. Enjoy! :D

Ciao!
Simo


Tuesday, December 18, 2012

Finding new cataclysmic variables and QSOs in the Kepler field-of-view

Creating complete and homogeneous samples of accreting white dwarfs (especially cataclysmic variables) has many added-value benefits than just finding new objects in the sky. It turns out that the number of cataclysmic variables we know about in the sky is about 10 times smaller that what is predicted by theory, and it is not clear whether this is because we are not looking properly for these objects, or whether our theoretical models are not so correct. Clean and homogeneous samples of these objects can clarify this discrepancy, and allow us to answer this big question: how many cataclysmic variables are out there (which in turn can help us understand how they got there in the first place!). Secondly, finding new cataclysmic variables in the Kepler field-of-view will also allow us to study the timing properties of these objects with unprecedented precision (see previous posts). But how do we go about finding these objects, when there are millions of targets in the Kepler field-of-view? How do we reduce this list of millions to just the good few which are of interest to us?


Fig 1: Spectra of newly identified cataclysmic variables in the Kepler field-of-view
To describe how I go about doing this we first need to know what the spectrum of a general cataclysmic variable looks like in the optical light. Well, the obvious features are the fact that the continuum of cataclysmic variables is generally brighter in blue than in red. Furthermore a clear feature of cataclysmic variables is that they have Hydrogen emission lines in their spectra: a consequence of the accretion disk being ionised (see Fig 1 for example spectra). These two facts can help us to find candidates by looking at photometric colours, and locating objects which are both blue(-ish), and at the same time have clear Hydrogen excess, when compared to, say, normal main-sequence stars. Fortunately the Kepler-INT survey (KIS, Greiss et al. 2012) provides us with the required photometry to search for such candidates. KIS is a multi-colour photometric survey, which will observe the whole Kepler field-of-view in the 5 photometric bands U,g,r,i and H-alpha. Just today the second release of the KIS catalogue appeared on astro-ph, which now covers ~97% of the whole Kepler field-of-view, and is complete to a faint magnitude of about 21 in the g band.

This survey is my starting point to find new and interesting objects. To select both blue and H-alpha excess candidates I look at the colour-magnitude and colour-colour diagrams of the field. From these diagrams I have developed a computer code which finds the main stellar locus (where the majority of objects are, mostly main-sequence stars), and then locate objects which lie on the blue side of it and at the same time show clear H-alpha excess emission. Fig. 2 shows how this works graphically. On the left we have the colour-magnitiude diagram showing colour U-g on the x-axis and magnitude U in the y-axis. Blue object in this plot are to the left. The colour-colour diagram on the right shows r-i on the x-axis and r-Halpha on thr y-axis. Objects owning H-alpha excess are located to the top-left. All the red dots are the systems my computer code considers as candidates, and show both blue and H-alpha excess. Out of more than 900,000 objects from KIS data-release 1, about 500 are selected with this method. Although this selection is promising (we only retain 0.0005% of the whole sample), 500 objects are still quite a lot to follow up spectroscopically. Anyhow I applied to take spectra of the brightest ones with the William Herschel Telescope on La Palma, and to my amusement I got the time to do this. At the end of May 2012 I went there and observed the brighest 38 candidates down to a magnitude of 19 in the U band. Each spectrum required 30 minutes of exposure, which kind of explains why taking spectra of all 500 is not a realistic option in the short run. Anyhow, what I found, again to my amusment, was that I was able to discover 11 new cataclysmic variables in the Kepler field, and on top of that I found 13 new Quasars (high redshift Active Galactic Nuclei, also very interesting for timing studies). The identifications of my spectroscopic run are also summarised in Fig.2, where the big coloured points represent different classes explained in the caption (see also Scaringi et al 2012). After finding these I was eager to get Kepler to observe these targets and obtain lightcurves. To my further amusement I submitted a DDT proposal, and a few months ago I found out that indeed my targets will be observed! :) Now I can't wait to get my hands on those spectacular lightcurves Kepler is getting, but for that I will have to wait a bit, at least until the next Kepler data down-link scheduled sometime in January. In the mean time, I have culled more candidates in the last few days from the new KIS data release 2, and asked  Anna Faye Mc Leod (my beautiful wife! :D ) and Thomas Kupfer (both at RU Nijmegen) to observe a few. It turns out that my selection criteria is working quite well, and many more cataclysmic variables are waiting to be found ;)

Fig 2: Colour-magnitude (left) and colour-colour (right) diagrams for stellar sources in the KIS data release 1. Red points represent candidate cataclysmic variables selected as described in the text. Large points are those where spectroscopic follow-up observations were performed. Large red triangles are newly identified cataclysmic variables, green squares are newly identified QSOs.
Until I get the Kepler lightcurves of these new objects I'll play with some other observations I have been gathering on MV Lyrae using ULTRACAM on the WHT, but I think this will do for this  post, and you'll have to wait for the next one before I tell you more about those observations (which by the way also have a high "coolness" factor! )

Ciao
Simo     

Wednesday, November 14, 2012

The Universal sound of accretion

I'll begin this post by noting that some observational properties of accreting black holes/neutron stars (with mass ranges from a few solar masses to a few million) are very similar to those observed in lower-mass accreting white dwarfs. Some of these similarities have been noted when observing how the spectrum of these objects changes as a function of time during their daily, monthly or yearly evolution. For example most accreting systems become brighter from time to time due to matter in the accretion disk falling onto the compact object relatively quickly. This increase in brightness is soon followed by a burst at radio wavelengths due to the presence of a high velocity jet being ejected from the system (see figure 1 of "The different scales of accretion").

These similarities, however, have been observed on long(-ish) time-scales, and do not probe the fast behaviour of the accretion disks which tells us something about how matter is transported within the disk. Does the disks in accreting white dwarfs, which seemingly go through similar changes to accreting black holes and neutron stars, also show other properties which resemble their more massive cousins? Lightcurves, as opposed to spectra, allows us to probe the fast variations generated within the accretion disk, however at the cost of loosing most spectral information.

It turns out that when we observe X-ray lightcurves of accreting black holes and neutron stars (with mass ranges from a few solar masses to a few million) we find a tight linear correlation between the mean count rate (or simply flux/brightness) and the lightcurve rms (the root-mean-squared or simply the spread of variability): the so-called rms-flux relation. Although this might sound very technical (what is this rms?!?) the implications of the rms-flux relation are quite important, and tell us a lot about what is actually happening in the accretion disk very close to the compact object (which we see directly through X-rays) as well as further out in it's outskirts (which we do not see directly). The rms-flux relation in X-ray lightcurves imply that the different variability mechanisms which produce the observed variations must originate in different places in the disk (maybe different radii?), and must interact in a very specific way to produce the X-ray lightcurves we observe.

One example of this would be if we imagine mass-transfer variations (how much mass goes through per unit time) through the outer-most edges of the accretion disk (see "The different scales of accretion"), and allow these variations to propagate inwards through the disk. As the variations propagate inwards they would couple to the variations produced further in (which will be different from the ones further out), until they reach the inner-most regions of the disk and emit X-rays. What we would then observe in X-ray lightcurves of accreting systems would contain information regarding the mass-transfer variations throughout the whole disk, and not just it's inner-edges.


Figure 1: The sound from the different musicians in the valley will reach the listener at different times, making the song sound like a big mess. However all the information is there to recreate the original song! Excuse my poor art skills! :p
One analogy to the above example which comes to mind is the following: imagine a person standing at the end of a valley and listing to an orchestra play live in front of him/her, but where the musicians of the orchestra are all at different places relative to the listener. Some are at a few tens of meters, whilst others at a few hundred (see Figure 1). Although the whole orchestra will play in tune and keeping the correct rhythm, the listener will not perceive a nice, in-rythm. This because the sound from the different musicians will reach the listener at different times (due to constant sound speed in the valley), making the overall sound a big mess. Within this mess is however a lot of information, which in theory could be used to recreate the original song, taking into account the delays between the different musicians and pitch changes caused by the valley's shape. Although the above example is actually very crude compared to the accretion disks, I think it kind of gets the basic message across when we compare the sounds
of the different instruments travelling through the valley to the variations which travel through the accretion disk.

The inner-edges of the accretion disks in accreting white dwarfs emit mostly optical/UV radiation, as opposed to X-rays emitted by accreting black holes or neutron stars. To determine whether the "sound" of accretion around white dwarfs is similar to that of black holes/neutron stars I recently used optical lightcurves obtained with the Kepler satellite, and showed that one accreting white dwarf system called MV Lyrae also displays the so-called rms-flux relation. MV Lyrae, is in some ways similar to many other accreting white dwarfs which display a lot of variability (also referred to as flickering in the scientific community), and it might be that in fact all accreting white dwarfs might show this same feature, just like in X-rays for accreting neutron stars/black holes.

The above discovery has only been made possible thanks to the high-quality lightcurves obtained with the Kepler satellite, which contrary to observations taken from telescopes on Earth, can observe objects continuously at high precision without being hindered by day/night interruptions and atmospheric uncertainties. The implications of the result is that the accretion disks around white dwarfs seem to behave in a very similar way to the accretion disks surrounding black holes/neutron stars, although the sizes of these disks are over a billion times different(!!!)... but we have to look at the right wavelengths to find out!

Ciao
Simo

Tuesday, October 30, 2012

Eavsdropping on accretion disks: The Kepler view

Following from the previous post, the specific goal of my project is to determine whether the accretion disks in accreting black holes and neutron stars show similar features to the less massive accreting white dwarfs by "listening to their sound". Obviously this is not possible you might think: listening to sound? in space?!?! Technically that's right, you can't "listen" in space, but what you can do is look at tiny variations in the emitted light of these objects, and apply similar techniques as those used to analyse sound waves to understand the seemingly random light variations. These techniques transform lightcurves (time plotted against flux/magnitude, see Fig.1) to Fourier spectra, where one looks at the power (or amplitudes) generated at different frequencies (see Fig.2).
Fig.1: Light curve of the cataclysmic variable (accreting white dwarf) MV Lyrae obtained with the Kepler satellite. The observation consists of over 600 days of quasi-continuos monitoring every ~58 seconds and shows typical flickering observed in accreting white dwarfs.
To this end I am interested in the timing properties of accretion disks, and specifically at the non-periodic variability properties, also referred to as flickering in cataclysmic variables. I am trying to find (or not!) phenomenological similarities between the flickering properties of accreting white dwarfs to those observed in accreting black holes an neutron stars.
Fig.2: Power spectrum showing Frequency vs. Power x Frequency for the MV lyr lightcurve shown in Fig.1. The main features to note are the fact that over a wide range of timescales (thus frequencies) long variations contribute more power than shorter ones, and that at about 10^-3 Hz (tens of minutes) power drops very steeply.

In this respect a lot of work on the different techniques has already been developed to study variability in X-rays for X-ray binaries and Active Galactic Nuclei (accreting black holes or neutron stars). Until recently however these techniques could not have been applied to studies of accreting white dwarfs, since these systems are not X-ray bright sources, but instead emit most of their light in the optical/ultraviolet wavebands. This difference is mainly attributed to the fact that black holes and neutron stars have deep gravitational potential wells when compared to white dwarfs, resulting in the fact that most emission is emitted in X-rays close to the central compact object. Conversely the potential well of a white dwarf is not so deep, and although most of the emission is also originating from close to the central compact object, the emitting region is much further out (see comparison in Fig.3), resulting in the emission being optical/ultraviolet.
Fig.3: Schematic view of the two potential wells.
The major obstacle in applying the techniques developed for X-ray binaries is that optical observations of accreting white dwarfs from Earth are hindered by the fact that observations are not continuous (day/night interruptions) and suffer from atmospheric effects resulting in uncertainties in the data. However this has all changed since the advent of the Kepler satellite. Kepler is a space observatory (an awesome one too!) which observes one, and only one, patch of sky continuously since it's launch. It does this to simultaneously obtain lightcurves for over 150,000 objects in it's field-of-view of about 100 square degrees. It's main science drive is that of finding as many extrasolar planets as possible through continuous monitoring of many stars. The idea of detecting extrasolar planets is simple: when the planet passes in front of it's parent star during it's orbit we perceive a small change in brightness, and this change occurs periodically with the period being that of the planet around it's star. These changes in brightness are minuscule, and because of that Kepler is very sensitive to these small brightness changes. All of these specifications (the accuracy of the obtained lightcurves together with the continuous monitoring of objects) make Kepler a perfect tool to study variability in cataclysmic variables too! In fact thanks to Kepler we can, for the first time, apply the techniques developed to study X-ray binaries and Active Galactic Nuclei to cataclysmic variables. This is where my project lies: comparing the variability properties of cataclysmic variables to those of X-ray binaries with the aim to find similarities and differences between the two types of systems, and consequently learn something about how the accretion disks behave and what are the main physical process governing their dynamics. :)
The Kepler space observatory. Credit: NASA.
Ciao!
Simo

The different scales of accretion


In this first post I will try and describe the project I will be mainly undertaking during my time in Leuven. It has to do with accretion, and specifically the similarities observed within different accreting systems. Accretion is a ubiquitous phenomenon in the Universe, and is responsible for the growth of objects of all masses, from stellar-like objects to super-massive black holes at the centre of galaxies.

My project will specifically focus on a subset of accreting close interacting binary stars called cataclysmic variables. These systems usually consist of two stellar mass objects orbiting each other, but one of them is not actually a star but a white dwarf. The white dwarf is more massive that the star (although not by much on astronomical scales) however it's radius is much smaller. To make the point, one can imagine a white dwarf as having the same mass of our Sun, but all squished in a ball whose radius is that of planet Earth! The interesting and fascinating thing about cataclysmic variables (and indeed all close interacting binaries) is that the central compact object (a white dwarf in the case of cataclysmic variables) and the companion star are so close to each other that the gravitational potential of the compact object strips matter from the envelope of the secondary star.
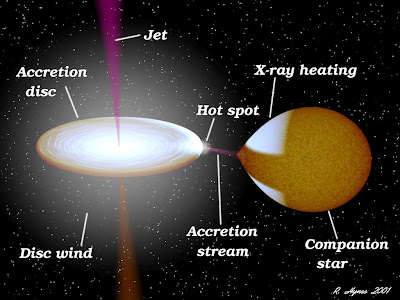
Schematic view of a compact interacting binary. Credit: R. Hynes
This stripped matter is then on it's way to the white dwarf, and forms a disk in order to conserve angular momentum. This disk is very dynamic, and for material to get closer to the central white dwarf, angular momentum must be lost through interactions with surrounding material. For example, viscous interactions is a mechanism by which angular momentum is lost (but defiantly not the only one!), and matter can gradually get closer and closer to the white dwarf, until it can settle on it's surface and increase it's mass by a bit. The issue however is that the laws that govern the physics within accretion disks are very hard to grasp, since within these disks many effects come to play, like viscosity, magnetic fields, radiation, and in some cases also relativity. Models which seek to reproduce the observed behaviour within these disks sometimes get it right, but most times are wrong! If we were to understand fully how these disks behave and how they relate to the systems which produce them we would be able to also understand better how the systems evolve in the first place, and what their fate will be. This in turn can have direct implications to how galaxies evolve, since white dwarfs are the end-state of most stars in the Universe and most stars are also found in binaries. Supernova Ia are also the result of a white dwarf gaining so much mass (presumably by accretion) that it surpasses the Chandrasekhar limit, resulting in a supernova explosion which can be seen throughout the Universe and can be used to measure it's size! 

My project will relate some of the observed phenomena within the disks of cataclysmic variables to their more massive counterparts: X-ray binaries and Active Galactic Nuclei. X-ray binaries are also close interacting binary systems, however the accretor in these cases is not a white dwarf but a more massive black hole or neutron star. On top of being more massive, black holes and neutron stars are also much smaller! In fact, if a white dwarf has the mass of the sun squished into the radius of the Earth, a neutron star is even more massive, and is squished into the size of a city! Black holes take it even a step further and are so dense that we don't even refer to it's surface any more but to the event horizon: the point where nothing, not even light, can escape from it's gravitational pull. For comparison, a stellar-mass black hole will have it's event horizon at just a few kilometres! Active Galactic Nuclei on the other hand are not binary systems, but accreting super-massive black holes (with masses reaching a few million times the mass of the Sun), usually situated at the centre of Galaxies. Although at first all these systems might seem wildly different in both mass and size, they all have one common feature: an accretion disk! It is the similarities between these different sized disks which fuelled a lot of (what I think is) interesting research in the last few years: the fact that although these disks are seemingly different, there exist relations which, if scaled properly, allow us the see that they all behave in a very similar way. Cataclysmic variables offer a nice way to study these similarities since there are many more of these systems in the galaxy than there are X-ray binaries. If we can learn from the numerous cataclysmic variables and find similar behaviour to the X-ray binaries, then we can hope to get a step closer in understanding how all these different systems behave and relate to each other, including Active Galactic Nuclei!

Ciao!
Simo

Saturday, October 27, 2012

Back on the blog!


Hello again! It's been a while since I last posted here! Hopefully I will make up for it by posting more often from now on. This is something I actually want to do for various reasons, but never actually get to do it as I loose my self in lines of code trying to analyse some data. Firstly, by posting on this blog I will have the chance to share some of my research and ideas with the wider public, but also with some experts in the field (hopefully!). Consequently, I hope some readers will comment back to ask questions and/or point out flaws in what I am doing. Secondly, I hope to fuel more ideas both for myself and others. Writing about what I do will help me to better focus on my research, whilst readers can find inspiration (or the lack of it!). Lastly, I recently got awarded a fellowship (!!!) to carry out 3 years of research at the Institute for Astronomy at KU Leuven, and in my proposal there was a specific section describing this blog post, and how I envisioned it. Well, now that I got the award I guess I need to stick to my word ;)

What I hope to do is to post every week or two a brief summary of what I am (trying!) to work on, or understand. This can be research I am actively doing myself, other peoples research I find interesting, or as sometimes will happen, observing runs at telescopes. The idea is to make this very informal, and try to keep the content simple enough so that people without a dedicated training in astrophysics can follow, but not too much as to loose the essence of some interesting results. I really hope I can manage this with this blog, and additionally I hope some readers bumping into this blog will comment back to let me know: 1) what they think of it 2) how I can improve it and 3) help me understand why some of those twinkly objects in the sky behave the way they do! :)

As I have not posted here for a while, I will post a few things soon to try and catch up! First a brief introduction on the project I am meant to carry out here in Leuven, and then a brief summary of some of articles of mine which recently got published (or are in the process of). Hopefully this will then set the scene! Hope you enjoy the reading!

Ciao
Simo

Tuesday, May 17, 2011

World-wide observing!

Another observing trip! Another country and another flight to the growing list just this month (9 for now + 2 to come!).
Just over a week ago I was lucky enough to have gone to Chile, and got to use one of the massive VLT telescopes! I was there for four nights as a visiting astronomer to use X-Shooter, a huge spectrograph observing all the way from the near infra-red, optical to the ultraviolet. The program to be observed was quite diverse, ranging from supernova, compact binaries, and even an exoplanet! (My first one...:D) Unfortunately the weather was not great. I learned that even on the driest desert on earth you do sometimes see black ugly clouds. I did loose observing time because of this (and had pointing restrictions some other times as well), but the most astonishing thing is that for a very short while on my last night it rained! This was only recorded at base camp (a few hundred meters below the VLT, and only for a few minutes), but still quite extraordinary given the fact that I was in the Atacama desert! Oh well, that is what you get when you do observational astrophysics: massive weather induced frustration! I've nearly learned to get used to it! Nevertheless, I did get some good and usefull data.
Today I just arrived on the beautiful island of La Palma in the Canary islands to begin a 10 day (!!!) observing run using the INT. This is part of an ongoing program to observe the Galactic plane in various broad and narrow photometric bands. Moreover in this run I will begin the Kepler field survey to essentially perform the same observations in the Kepler field. This is cool! :D and I can't wait to get my hands on the actual data and see what sweet objects are lurking in there waiting for Kepler to obtain spectacular light curves of them. Anyhow, for tonight I am "free" and will treat myself with a nice dinner and probably some wine, given that I will have to suffer the observatory food for the next 10 days!

Ciao!
Simo
Published with Blogger-droid v1.6.9